Mapping ticks in the Townships
- UdeMNouvelles
04/26/2023
- Béatrice St-Cyr-Leroux
A research team has created a Lyme disease risk map that integrates tick population density and human behaviour in the Eastern Townships.
Where in the Eastern Townships are residents most likely to contract Lyme disease? And why are they more at risk than others? What are the best ways to prevent the disease? Is it better to simply change people's behaviour or to take a more environmental approach?
Wutht these questions in mind, a research team led by Dr. Catherine Bouchard and Dr. Cécile Aenishaenslin at the University of Montreal’s Faculty of Veterinary Medicine set out to find the answers.
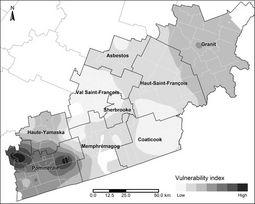
The researchers have produced a map of the risk of acquiring Lyme disease in the Eastern Townships by crossing-referencing data on the risk of human infection, tick population counts and the adoption of three preventive behaviours: checking the body for ticks after being in a high-risk environment, using repellents, and bathing or showering.
15 years of data
The integrated risk map is based on a 2018 population survey and on tick monitoring data collected since 2007. It provides a vulnerability and prioritization index to guide efforts to prevent Lyme disease.
“We hope this map will be a simple, accessible tool to help public health stakeholders quantitatively measure risk and determine which communities and interventions to prioritize,” said Bouchard, who is also a veterinary epidemiologist with the Public Health Agency of Canada.
The researchers found that high tick density doesn’t necessarily correlate with high risk of transmission when preventive behaviours have become ingrained.
“When people know how to protect themselves, based on years of messaging, we have fewer infections,” said Aenishaenslin. “However, adoption of more recent behavioural recommendations is spottier."
That’s where the map comes in.
"Integrating the information on tick and human populations can help pinpoint the measures we need to implement in each region," she said. "For example, should we ramp up messaging on preventive behaviour? Or would it be better to develop measures to reduce the number of infected ticks in the environment?”
In combining behavioural and environmental risk factors, the researchers are taking a “One Health” approach to Lyme disease prevention. “We’ve merged an approach centred on reducing the risk of disease with a health-promotion approach focused on developing sustainable solutions upstream,” Bouchard explained.
Highest risk in two areas
According to the study, the territories served by La Pommeraie and Haute-Yamaska local health and social service networks (RLS) top the list because of their higher population density, greater predicted tick population and inconsistent adoption of the three preventive behaviours.
Based on the average-prioritization index, the top 20 at-risk municipalities, in alphabetical order, are: Ange-Gardien, Brigham, Brome, Bromont, Cowansville, Dunham, Granby, East Farnham, Farnham, Frelighsburg, Lac-Brome, Notre-Dame-de-Stanbridge, Saint-Alphonse-de-Granby, Sainte-Brigide-d’Iberville, Saint-Ignace-de-Stanbridge, Sainte-Sabine, Sherbrooke, Sutton, Stanbridge East and Valcourt.
“We weren’t surprised, knowing that these RLSs are prime tick habitats and thus have abundant tick populations,” Bouchard said. “But most importantly, it’s because people’s homes lie plumb in the middle of the tick’s habitat. This proximity increases the probability of exposure.”


