
Charting the difference
- Salle de presse
04/24/2020
- Jeff Heinrich

Whichever way the progression of COVID-19 is depicted in a chart, Canadians still think it’s a good idea to stay home, a new study finds.
Credit: Getty

Whichever way the progression of COVID-19 is depicted in a chart — as a steep curve or a gradual upward line — Canadians still think it’s a good idea to stay home, a new study finds.

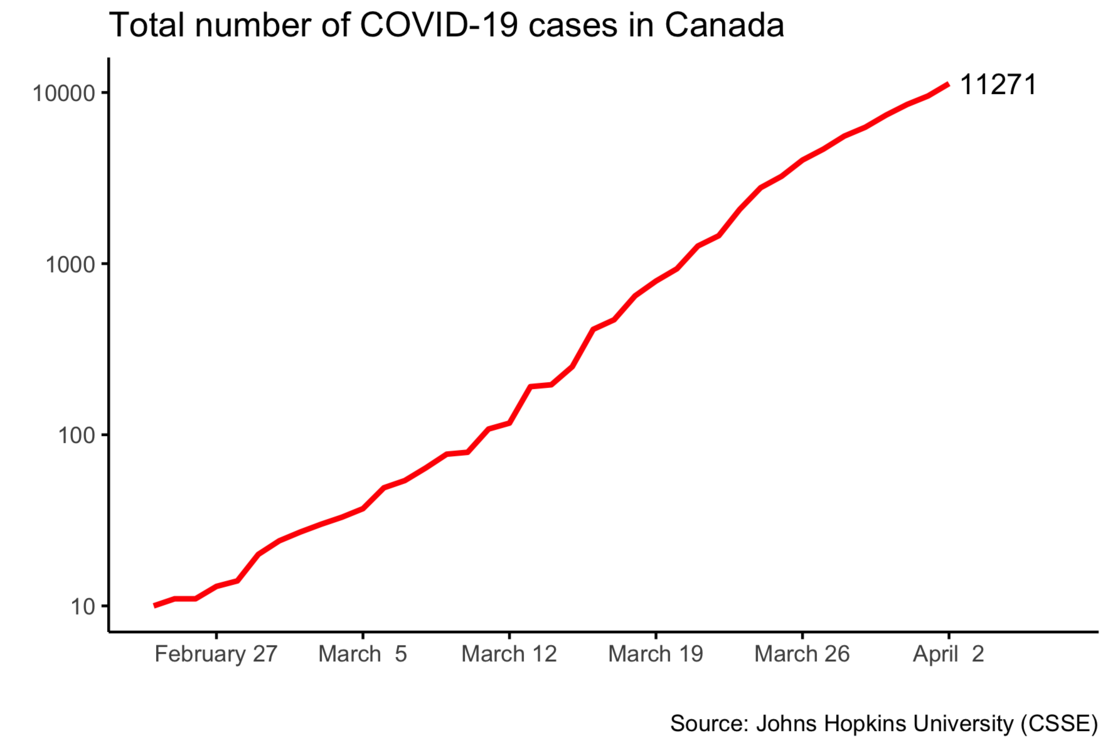
The way most people understand how rapidly COVID-19 is spreading is by seeing its progression plotted in a chart — specifically, a graph showing the cumulative number of confirmed cases increasing over time. Those increases on the vertical axis are shown in one of two ways: most commonly, as a linear scale, and less commonly as a logarithmic scale.
Linear scales are more dramatic and easier to understand, showing a steep increase as the total number of cases quickly add up after health crisis takes hold; these are the scales most often used in the media. Log scales are less dramatic, showing only a gradual increase, and they are preferred by experts in disease control.
Why? Because log scales are a better way to quickly assess growth rates of the pandemic, allowing experts see how COVID-19 cases are increasing exponentially. In Canada, for instance, the number has increased by a factor of 10 since mid-March; on a log scale this shows as a straight slope that only changes if there’s a rise in the growth rate.
But what about the general public? In society, citizens look to their governments and public-health authorities for guidance on how to self-isolate and abide by other drastic measures to help contain the pandemic. Are they more supportive of these measures if they see dramatic linear plots? Would they be more optimistic if they could read “tame” logarithmic plots?
To find out, Université de Montréal political-science professors André Blais and Vincent Arel-Bundock, along with six of their students and a colleague from the University of Toronto, set out this month to survey Canadians on how the two types of graphs change how they feel about the COVID-19 crisis and their role in helping stop its spread.
What the researchers found was a surprise: no matter which visualization they were given, linear or logarithmic, Canadians surveyed still believe it’s best to abide by the authorities’ confinement measures — and this, for several months more. The findings are published online in the Canadian Journal of Political Science.
‘We were wrong’
“We thought we might see a difference of opinion in people who were shown the graph drawn on the logarithmic scale, because the slope is less steep and might give the appearance of the risk of contagion being less serious,” said Blais. “But it turns out we were wrong.”
Indeed, there was essentially no difference between the two treatment groups, or between the treatment groups and the control group, in terms of how they felt about the authorities’ containment measures.
Whether shown a graph with a logarithmic or a linear scale, 54 percent said they fully support the measures — a score of 10 on a 0-to-10 scale. Furthermore, a strong majority of Canadians believe that confinement will have to last at least two more months; only 10 per cent expect most people to come back to work in April or May.
Another surprise: it didn’t matter if the respondents were young or old, male or female, educated or not, living in cities or rural areas: the vast majority of Canadians are strongly in favour of confinement. Quebeckers, for their part, expect to return to work a bit sooner, but they support confinement even more than other Canadians.
“Canadians have already formed strong and firm opinions on the issue; they have come to believe that this is a serious crisis and that the authorities are doing what is necessary,” the researchers conclude in their study.
“Providing them with differing visual displays of information has no effect on these views.”
Willing to accept

“What this shows,” said Blais, “is the stunning success of public-health experts and governments in convincing Canadians that the measures taken are necessary and may have to last for at least some months. It’s not a nice or easy thing to ask of them, but Canadians seem willing to accept restrictions along with the bad news that the crisis is not ending soon. “
The survey of 2,500 Canadians was done between April 3 and 5. Each participant was randomly assigned to one of three groups: a control group given no information about the COVID-19 outbreak in Canada; a treatment group shown the cumulative number of cases in a liner graph; and a second treatment group shown the same number in a logarithmic graph.
Both graphs were similar to those published in major Canadian newspapers and displayed by epidemiologists and government agencies in news conferences, and so closely map how people experience and consume information about the pandemic. As a result, the researchers say, the survey reflects real life and is therefore valid scientifically.
After being shown the graphs, the participants were asked two questions: First, on a scale of one to 10, did they support their governments’ instructions to remain at home? And second, on the contrary, did they think the authorities should soon allow almost everyone to go back to work?


About this study
“Logarithmic vs. linear visualizations of COVID-19 cases do not affect citizens’ support for confinement,” by Semra Sevi, Marco Mendoza Avina, Gabrielle Péloquin-Skulski, Emmanuel Heissbourg, Paola Vegas, Maxime Coulombe, Vincent Arel-Bundock, Peter Loewen, and André Blais ,was published April 21, 2020 in the Canadian Journal of Political Science.
Media contact
-
Jeff Heinrich
Université de Montréal
Tel: 514 343-7593


, all airborne contaminants with adverse effects on human health.")


